
Chart Generator
Turn pasted CSV, JSON, or plain text into configurable charts and downloadable reports — instant data visualization.
This hub collects free browser-based data transformation, visualization, and analysis tools for analysts, developers, and data teams in 2026: chart builders, CSV tools, XML formatters, data converters, diff checkers, and log analyzers — no signup required.
Updated · Reviewed by The Free AI Tools Editorial Team — Data tools and visualization review
Turn pasted CSV, JSON, or plain text into configurable charts and downloadable reports — instant data visualization.

Convert CSV data to JSON and vice versa with ease — perfect for data import/export and API payload preparation.

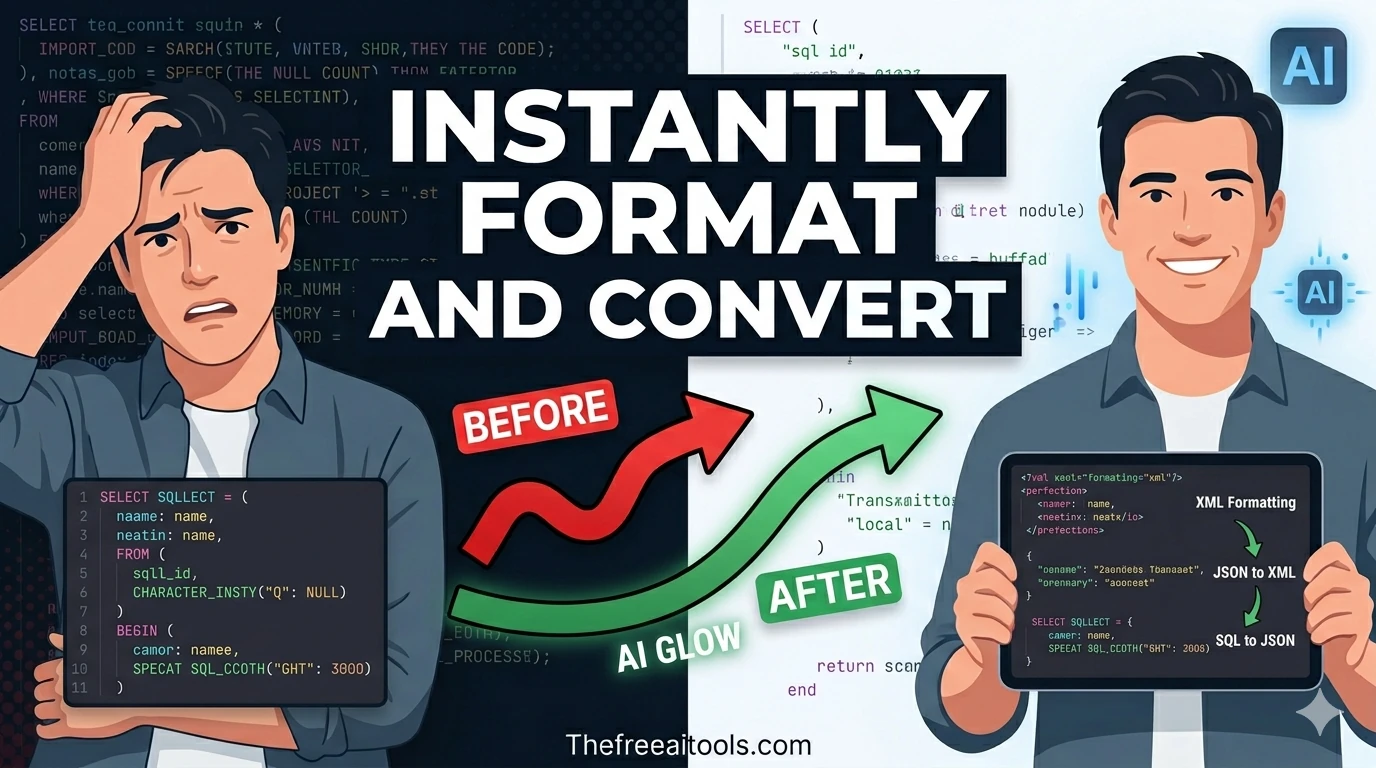
Pretty-print XML and flag malformed markup in your browser — format RSS, SOAP, and config XML files.

Transform JSON objects into formatted XML markup — convert API payloads to XML for SOAP and legacy integrations.

Compare two blocks of text and highlight additions and removals — visualize code and content changes instantly.

Create a visual SVG word cloud from any text input — great for content analysis, presentations, and data visualization.
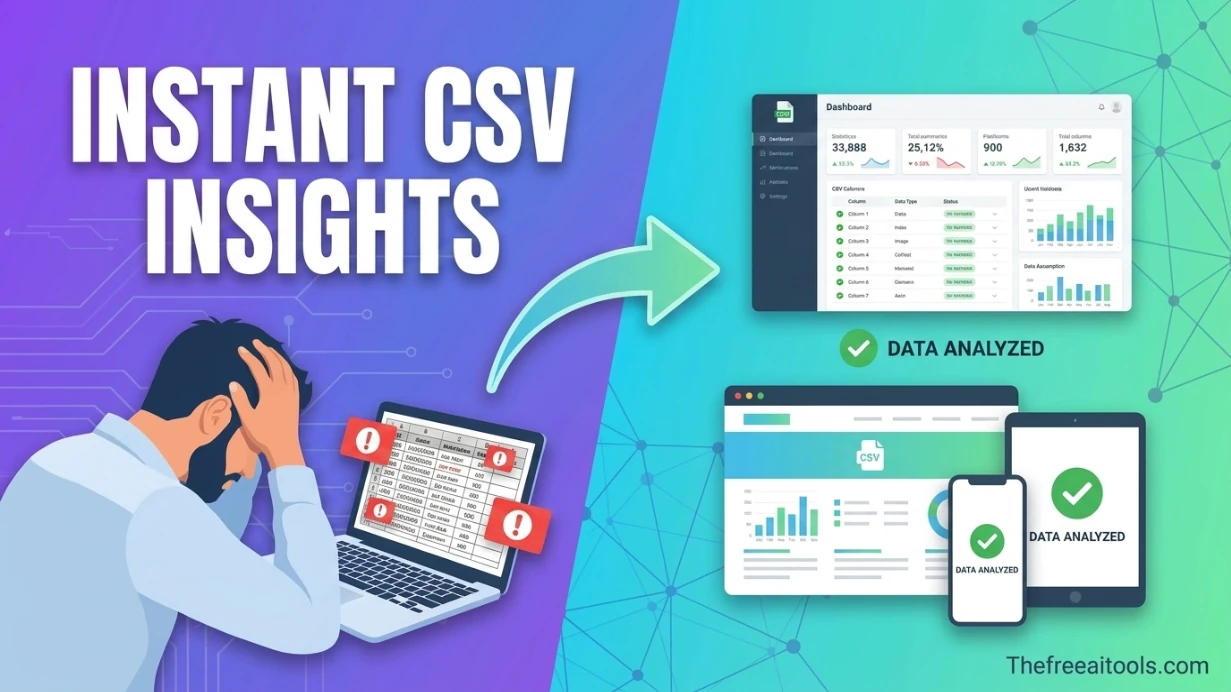
Profile CSV headers, fill rates, and likely column data types from pasted data — data quality analysis.
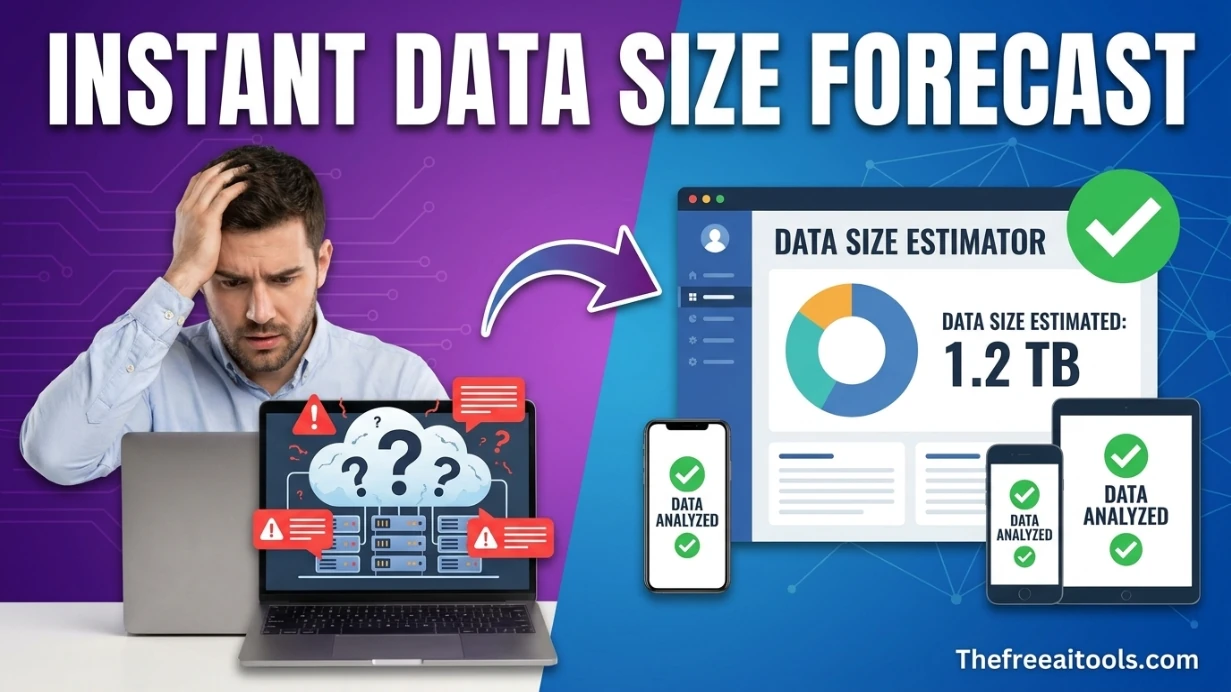
Estimate dataset storage growth from row counts and average row sizes — database capacity planning tool.

Convert between YAML and JSON formats instantly — essential for CI/CD, Kubernetes, and API config workflows.
Turn SQL INSERT statements into JSON data structures — useful for data migration and API payload generation.

Clean up JSON logs, key-value lines, and stack traces for readability — debug server logs instantly.

Search nested JSON objects and return matching paths for keys and values — JSONPath query tool.

Generate JSON Schema from sample payloads, validate example objects, and inspect required fields or type mismatches. It is useful when teams need portable contracts without spinning up a backend.
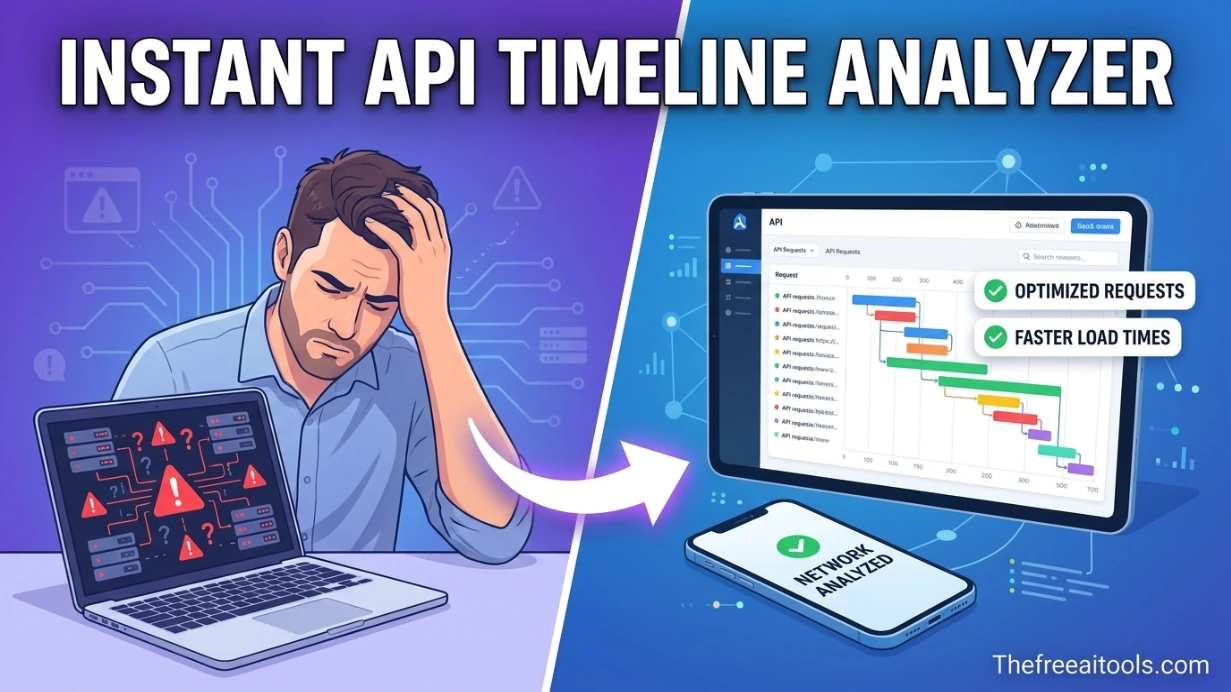
Open HAR exports locally and turn them into a sortable timeline for slow requests, waterfalls, headers, and payload sizes. It helps engineering and QA teams diagnose frontend performance without uploading logs.
Format and beautify SQL queries for better readability — clean up messy SELECT statements and JOIN chains.

Format, validate, and minify JSON with error highlighting — instantly beautify messy JSON responses.

Convert plain text into binary and decode binary back to text — essential tool for encoding and CS education.
Data transformation and analysis are daily activities for most development and data teams, and many routine data tasks — converting formats, profiling columns, comparing versions, generating quick visualizations — are too small to justify the overhead of spinning up a full data science environment.
Chart generation is one of the most requested quick-tool features for professionals in non-technical roles. Business analysts, marketers, project managers, and product teams regularly need to turn tabular data into visual charts for reports and presentations.
Data format conversion is a constant need in systems integration, API development, and data engineering work. JSON to XML, CSV to JSON, SQL results to JSON — each conversion follows a defined transformation that is mechanical and error-prone when done manually.
Diff checking is an essential utility across multiple professional contexts. Developers use diffs to review code changes, DevOps teams compare configuration file versions, and content editors compare document drafts.
Quick answers about the workflow, privacy, and where this tool fits in a broader job.
The chart generator supports bar charts, line charts, pie charts, scatter plots, area charts, and histogram formats.
The CSV column profiler analyzes a CSV file and produces a statistical summary for each column: data type inference, value count, null count, unique value count, min/max, and most frequent values.
The diff checker compares two text inputs and highlights the differences line by line. Added lines appear in green, removed lines in red, and unchanged lines in white.
The log formatter parses raw application or server log output and structures it into a readable, color-coded display, handling common log formats including JSON logs and Apache/Nginx access logs.
The word cloud generator analyzes your text input, calculates the frequency of each word, and generates a visual word cloud where more frequent terms appear larger.
The complete toolkit
Every tool runs instantly in your browser — no account, no download, no cost. Across 13 categories for everyday tasks.