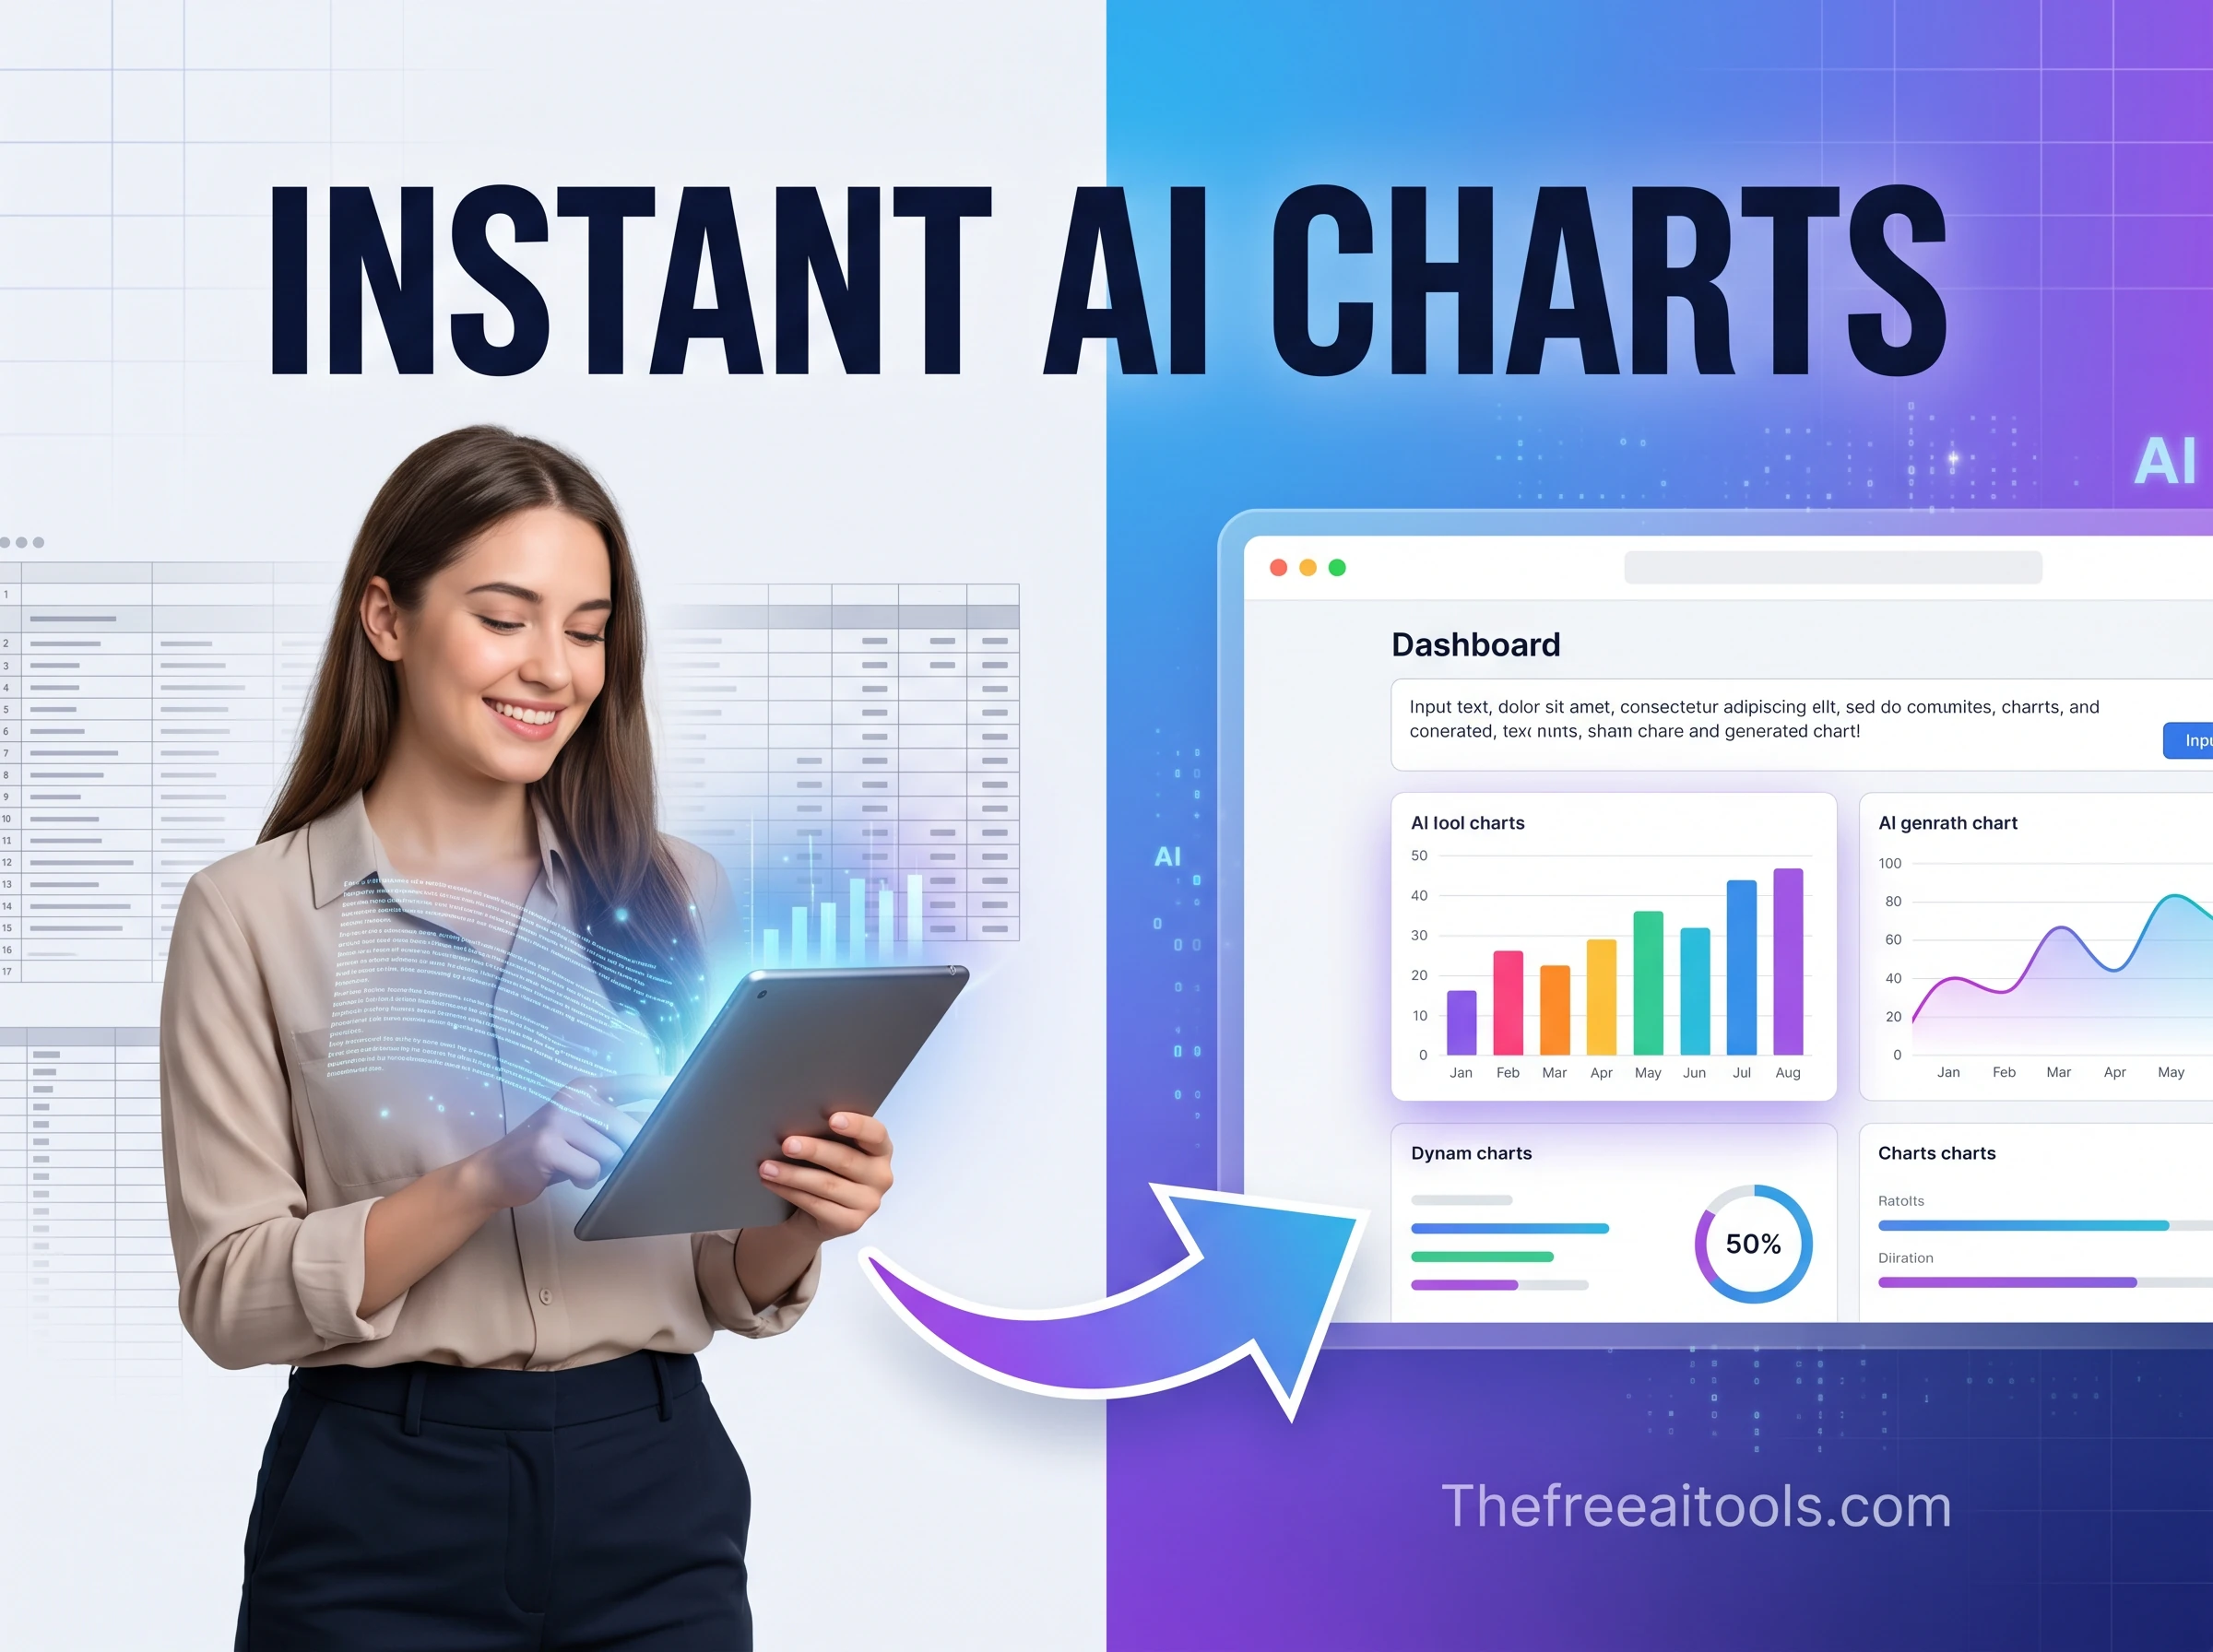
Chart Generator
Turn pasted CSV, JSON, or plain text into configurable charts and downloadable reports — instant data visualization.

Profile CSV exports, chart data, test network speed, and inspect logs and structured data without uploading files.
Working with data means a constant stream of inspect-transform-validate tasks: pretty-printing a minified API response, validating that a JSON payload matches its schema, parsing a user-agent string out of a log line, or converting between data formats. Doing this in a notebook or a one-off script is overkill, and pasting sensitive data into an unknown web tool is a risk. Our free data and analytics tools online run client-side in your browser — no account, no upload, no logging — so you can work with production-shaped data safely. The collection covers JSON formatting and validation, data format conversion, log and user-agent parsing, and analytics utilities. Each tool is built for the reality of messy real-world data: malformed JSON, inconsistent encodings, and edge cases that break naive parsers. You get fast, accurate results without exposing the data you're inspecting.
Turn pasted CSV, JSON, or plain text into configurable charts and downloadable reports — instant data visualization.
Measure download, upload, ping, and jitter directly in your browser with a quick connection benchmark.
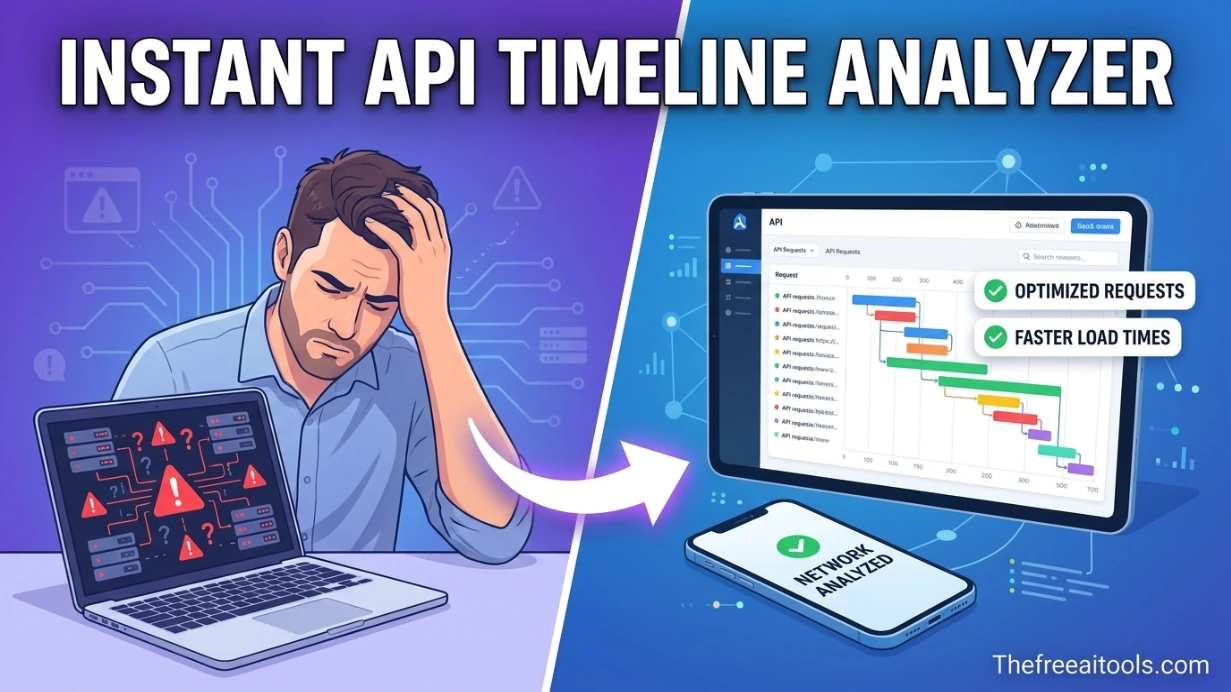
Open HAR exports locally and turn them into a sortable timeline for slow requests, waterfalls, headers, and payload sizes. It helps engineering and QA teams diagnose frontend performance without uploading logs.
Format and validate JSON responses to spot the missing comma or unclosed bracket that broke a parse. Pretty-print a 2,000-character single-line payload into a readable tree so you can find the field you need without scrolling horizontally.
Parse user-agent strings to identify which browsers and bots hit your site, extract structured fields from log lines, and analyse response patterns. User-agent parsing is notoriously unreliable for version detection — the tools flag what's trustworthy versus what's spoofable.
Convert between JSON, CSV, and YAML during pipeline development, validate data against a schema before ingestion, and inspect data types to catch inference problems early. Catching a type mismatch here prevents a failed load downstream.
Compare an API response against a known-good snapshot, validate that required fields are present and correctly typed, and confirm that an export matches its specification before it ships to a customer or partner.
No. JSON formatting, validation, format conversion, and parsing all run locally in your browser using client-side JavaScript. Your data never leaves your device, which is essential when you're inspecting production payloads, customer data, or anything sensitive.
The validator runs the same parsing logic as the native JSON.parse(), pinpointing the line and character where parsing fails — typically a trailing comma, an unquoted key, or a single quote where JSON requires double quotes. It distinguishes a syntax error from valid-but-unexpected structure.
User-agent strings are historically full of compatibility lies — every browser claims to be 'Mozilla', and many spoof other browsers' tokens for compatibility. Browser family and OS are reasonably reliable; exact version numbers and device detection are easily spoofed and should not be trusted for security decisions.
Yes, within your browser's memory limits. Files up to several megabytes format and validate near-instantly on a modern device. Extremely large files (hundreds of MB) may be slow or hit memory limits — for those, a streaming command-line tool is more appropriate.
Common conversions include JSON to and from CSV, YAML, and XML. Each conversion notes what's preserved and what's lost — for example, YAML comments and anchors don't exist in JSON, and CSV has no nested structure, so deep JSON objects must be flattened.
It can. CSV is a flat, tabular format with no concept of nested objects or arrays. Deeply nested JSON must be flattened (using dotted keys) or it can't be represented faithfully. The conversion is lossless only for already-flat, array-of-objects JSON.
Hand-picked sets of free tools and guides related to data & analytics.
224+ browser-based tools across 13 categories — all free, no sign-up required.